Takeover Backtest Part 3: Three Signals Raise the Odds, None Makes Money
Part 2 of this study failed on scarcity: at a base rate near one percent, a takeover is simply too rare to turn into an edge. Part 3 attacks that from both sides. It replaces the price-pattern detector with SEC filings as ground truth - 5,599 documented takeovers instead of 1,059 price matches, a twelve-month base rate of 3.1 instead of 0.83 percent. And it swaps quiet balance-sheet traits for loud public events: an industry consolidation wave, an activist filing a Schedule 13D, and a board announcing a review of "strategic alternatives". All three genuinely work as predictions - the odds of a takeover double to triple. And still not one of them makes money. The probability is already in the price.
 Thomas Mücke
Founder & Publisher
Thomas Mücke
Founder & Publisher
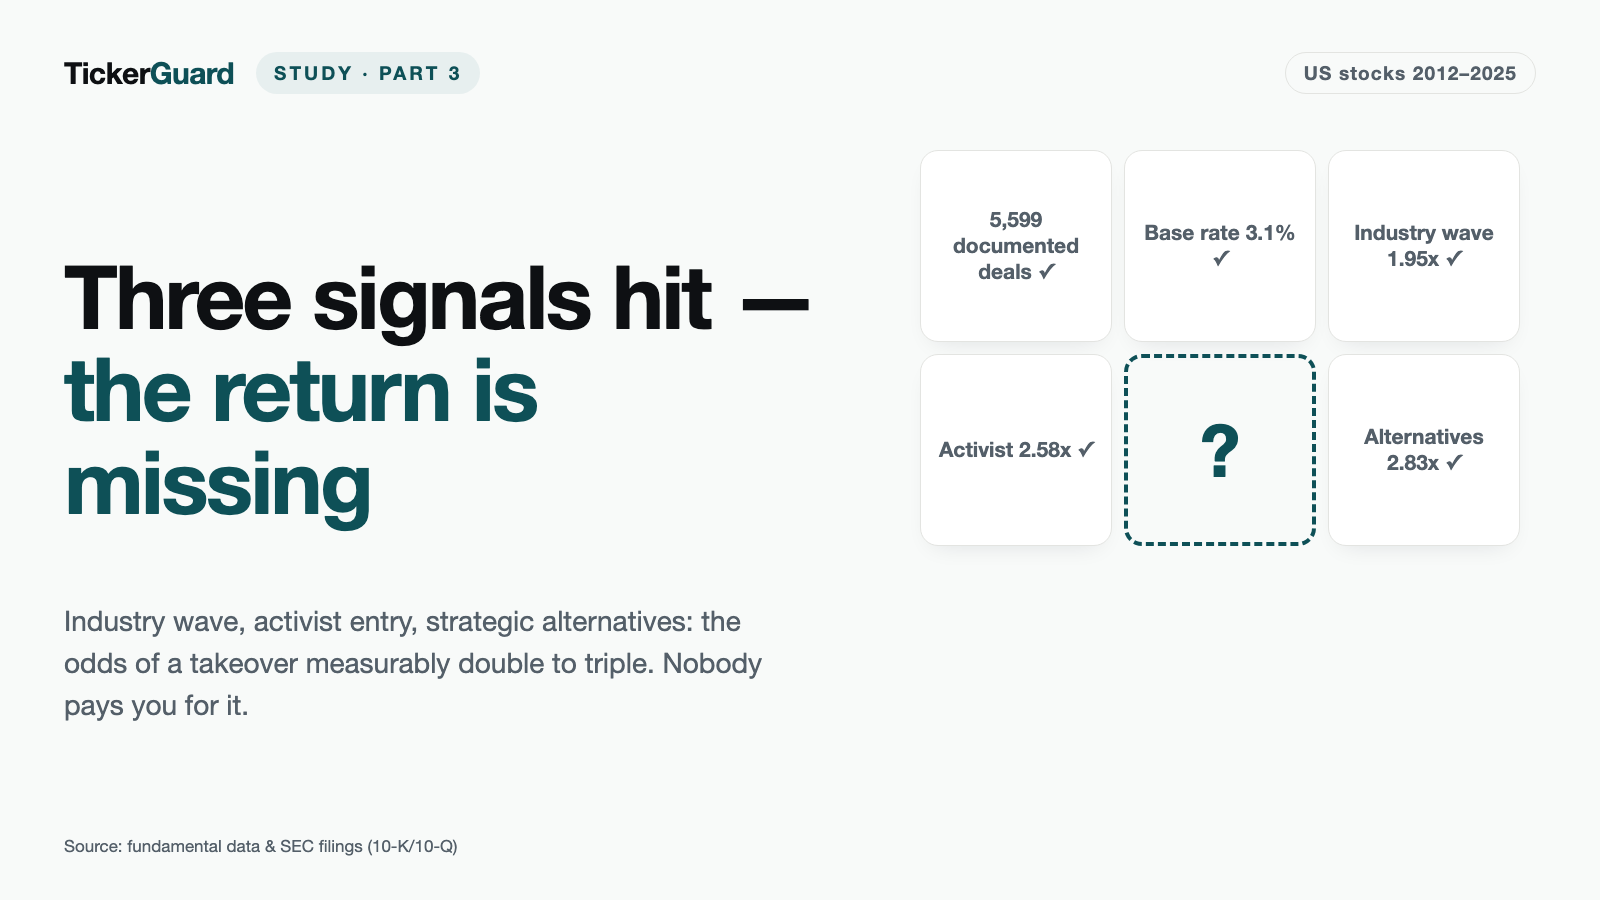
Part 2 of this study ended with a clear no: a takeover target cannot be predicted from company traits. The main obstacle was not the model but scarcity - at a base rate of 0.83%, a signal has to be almost impossibly strong just to become visible. Part 3 attacks that on two fronts. First with a better ground truth: instead of inferring takeovers from price behaviour, we read the filings companies make with the SEC. Second with a different kind of signal: not quiet balance-sheet traits, but public events any market participant can see the day they happen.
The result is the most interesting one in this series - and it is another no, but a different one. All three events tested genuinely work as predictions. You just do not get paid for them.
The result in four numbers
| Number | What it means |
|---|---|
| 5,599 | documented takeovers across 4,202 firms - read from SEC filings rather than inferred from price patterns (Part 1: 1,059) |
| 2.83x | the strongest lift measured: a "strategic alternatives" announcement raises the twelve-month takeover rate from 3.23% to 9.14% |
| 13.29% | the best portfolio result (industry peers, twelve months, after costs) against 13.84% for the S&P 500 price index - it loses |
| 9.14% | the real twelve-month sale rate after a "strategic alternatives" announcement - the widely quoted 50% only holds with no time window at all |
The new foundation: 5,599 documented takeovers
Part 1 identified takeovers from a price signature - a jump, then a tight sideways range through delisting. That only ever catches all-cash deals, and not even all of those. Part 3 replaces the detector entirely: for every delisted US company we read the full filing history at the SEC and look for the forms a takeover is legally executed with - merger prospectuses (425), proxy materials (PREM14A, DEFM14A), tender offer documents (SC TO-T, SC 14D9) and the deregistration forms 25-NSE, 15-12B and 15-12G.
| Stage | Value |
|---|---|
| delisted US tickers in the dataset | 11,081 |
| matched to an SEC filer number | 9,709 (87.6%) |
| filing histories successfully retrieved | 100.0% |
| documented takeovers | 5,599 (50.5% of all delistings) |
| firms affected | 4,202 |
| delistings with another documented reason | 2,100 |
| delistings with no identifiable reason | 3,382 |
The cross-check is unambiguous. Of 37 known benchmark deals - prominent takeovers any usable dataset must contain - the new ground truth finds 37. The Part 1 price detector found 12. Going the other way, the filing record confirms 943 of 1,034 checkable price-pattern matches (91.2%) as genuine takeovers, and adds 4,656 takeovers the price pattern had missed entirely.
That changes the single most important number in the study. The probability that any given stock in the investment universe is acquired within twelve months rises from 0.83% (Part 2) to 3.107%.
| Window | Stock-months | Takeovers | Base rate |
|---|---|---|---|
| 6 months | 606,603 | 9,980 | 1.645% |
| 12 months | 580,171 | 18,027 | 3.107% |
| 18 months | 552,808 | 24,387 | 4.411% |
| 24 months | 523,738 | 29,213 | 5.578% |
Who gets acquired
The probability is far from evenly spread. Small companies are acquired almost four times as often as large ones, and among sectors financials lead by a wide margin - decades of US regional-bank consolidation show up directly in these numbers.
| Size bucket (1 = smallest) | Stock-months | Takeover rate (12 months) |
|---|---|---|
| 1 | 116,093 | 4.688% |
| 2 | 116,039 | 4.418% |
| 3 | 116,024 | 2.971% |
| 4 | 116,039 | 2.277% |
| 5 (largest) | 115,976 | 1.180% |
| Sector | Stock-months | Takeover rate (12 months) |
|---|---|---|
| Financials | 135,411 | 4.918% |
| Health Care | 73,701 | 3.464% |
| Energy | 37,003 | 3.386% |
| Information Technology | 63,335 | 2.990% |
| Real Estate | 29,097 | 2.285% |
| Communication Services | 28,727 | 2.249% |
| Industrials | 74,880 | 2.001% |
| Consumer Discretionary | 59,608 | 1.726% |
| Materials | 31,606 | 1.563% |
| Consumer Staples | 21,091 | 1.498% |
| Utilities | 16,318 | 1.213% |
Signal 1: the industry wave
The idea is old and plausible: takeovers arrive in waves. Once one competitor buys another, the remaining companies in that industry come under pressure - as buyers and as targets. So we measured: if a stock sits in an industry where a takeover has just been announced, how often is it acquired within twelve months? The comparison is not the market average but stocks of the same size bucket in the same month whose industry has no fresh wave.
| Window | Peers | Takeover rate | Expected (matched) | Lift |
|---|---|---|---|---|
| 6 months | 321,203 | 2.63% | 1.34% | 1.96x |
| 12 months | 298,977 | 5.02% | 2.58% | 1.95x |
| 18 months | 277,825 | 7.20% | 3.84% | 1.87x |
| 24 months | 255,558 | 9.15% | 5.09% | 1.80x |
That is a genuine effect - and almost all of it sits in the dose. A single takeover in the industry moves essentially nothing; the rate only jumps from the second deal onward.
| Dose (12 months) | Peers | Takeover rate | Expected | Lift |
|---|---|---|---|---|
| exactly 1 deal in the industry | 77,032 | 2.41% | 2.08% | 1.16x |
| 2 or more deals | 221,945 | 5.93% | 2.76% | 2.15x |
So anyone betting on industry consolidation should not react to the first deal but to the second. Which brings us to the question that matters: what does a portfolio doing exactly that earn?
| Series (12-month hold, 0.2% cost per leg) | Mean | Median | Share of winners |
|---|---|---|---|
| Industry peers (the portfolio) | 13.29% | 8.15% | 64.5% |
| S&P 500 (price index, no dividends) | 13.84% | 14.80% | 83.2% |
| Investment universe, equal-weighted | 12.69% | 9.05% | 72.4% |
| Matched control industries (no fresh event) | 11.89% | 10.70% | 72.5% |
This is the best arm in the study - and it loses. It beats its own investment universe by 0.6 points and the matched control group by 1.4 points, but not the index. The decision rule had been fixed in advance and required three things at once: a lift of at least 1.5x, stability in at least 70% of years, and a win against both benchmarks. Only the lift clears; year stability comes in at 55.6%, and the index comparison is lost. Not viable.
The breakdown of where the return comes from is instructive. Of 295,039 fully covered positions, 16,285 were themselves acquired - 5.52% of positions carrying 12.9% of total return, averaging 24.63% against 9.68% for the rest. The takeover premium is real and large. It is simply too rare to pull the other 94% of ordinary positions along with it.
Signal 2: an activist shows up
Anyone crossing 5% ownership in a US company with intent to influence it must disclose that within days - Schedule 13D. It is the classic opening move of a campaign, and campaigns often end in a sale. We processed all 22,353 first filings in the SEC form index, deduplicated to 12,897 events using a 24-month cooling-off window per target company.
The first finding is a coverage limit rather than a return figure: only 27.0% of first filings land in the measured investment universe at all. Activists overwhelmingly target companies below the threshold of $100 million market cap and a $1 share price. Anyone trading these filings is therefore trading mostly in a size class this study deliberately makes no claim about.
| Arm (12 months) | Events | Takeover rate | Expected | Lift |
|---|---|---|---|---|
| all 13D first filings | 2,834 | 5.65% | 3.86% | 1.46x |
| well-known activist filers | 240 | 6.67% | 2.59% | 2.58x |
The name is what makes the difference: an arbitrary 13D raises the odds by roughly half, while a filing by Icahn, Elliott, Starboard, JANA, ValueAct, Third Point, Pershing Square or Trian raises them more than two and a half times. That list was fixed in advance, not assembled after the fact from the hits.
Then the returns - and this is where it gets uncomfortable:
| Series (12 months, after costs) | All 13D | Well-known activists |
|---|---|---|
| Event portfolio | 9.64% | 6.52% |
| Matched control group | 14.25% | 12.21% |
| S&P 500 (price index) | 13.29% | 12.63% |
| Investment universe, equal-weighted | 13.57% | 12.50% |
Both arms land below their own control group - by almost six percentage points in the case of the well-known activists. That is worse than "no edge": buying after a 13D filing did worse on average than buying a comparable stock without the event.
The breakdown explains why. Of 2,817 fully covered positions, 166 were themselves acquired. Those 5.9% of positions carry 22.1% of the entire return and average 17.76%. The rest averages 3.91% - with a median of minus 1.83%. The typical stock an activist buys into loses money. A handful of large takeovers drag the average above zero; anyone who does not happen to hold those sits with the majority.
Signal 3: "strategic alternatives"
When a board announces it is reviewing "strategic alternatives", that is in practice the politest available phrasing for: the company is for sale. So we searched the SEC full-text index for nine phrases fixed in advance - from "review of strategic alternatives" and "exploring strategic alternatives" through to "process to maximize shareholder value". The result: 10,239 document hits, 6,774 filings, 2,406 companies, 2,924 first announcements after deduplication, of which 1,276 fall inside the measured universe.
| Window | Events | Takeover rate | Expected | Lift |
|---|---|---|---|---|
| 6 months | 1,090 | 5.51% | 1.65% | 3.33x |
| 12 months | 1,029 | 9.14% | 3.23% | 2.83x |
| 18 months | 965 | 10.36% | 4.64% | 2.23x |
| 24 months | 926 | 12.53% | 5.94% | 2.11x |
This is the strongest predictive value measured anywhere in the series - and the shape is exactly right: the lift is largest at the shortest window (3.33x after six months) and decays as the comparison group catches up. A signal that only works shortly after the event behaves precisely the way real information has to behave.
The returns still trail:
| Series (12 months, after costs) | Mean | Median |
|---|---|---|
| Event portfolio | 10.14% | 7.30% |
| Matched control group | 13.32% | 11.55% |
| Investment universe, equal-weighted | 13.19% | 11.39% |
| S&P 500 (price index) | 13.11% | 14.16% |
Here too the event portfolio sits more than three percentage points below its own control group. The strongest signal in the study produces one of its weakest portfolios.
The side finding: that 50% claim
One number circulates constantly in market commentary around this signal: roughly half of all companies announcing "strategic alternatives" end up being sold. Our dataset can test that - and finds the number is accurate and still misleading.
| Definition | Population | Acquired | Rate |
|---|---|---|---|
| ever acquired (no time window) | 2,087 | 917 | 43.94% |
| within 24 months | 1,866 | 383 | 20.53% |
| within 12 months | 2,087 | 323 | 15.48% |
| within 12 months, inside the universe | 1,029 | 94 | 9.14% |
The widely quoted figure corresponds to the top row: eventually, across the whole observation period. What matters for an investment decision is the window in which capital is tied up - and there it is 9% to 15%, not 50%. The gap between "gets sold" and "gets sold soon" is the entire gap between a headline and a return. Our figure is also biased downward, because an announcement only enters the dataset once the deal has closed - it is a floor, which is the direction that would support the published claim rather than refute it.
Why a real signal still makes no money
The core result of Part 3 fits in one table:
| Signal | Lift (12M) | Portfolio | Matched control | S&P 500 | Verdict |
|---|---|---|---|---|---|
| Industry wave | 1.95x | 13.29% | 11.89% | 13.84% | not viable |
| 13D first filing | 1.46x | 9.64% | 14.25% | 13.29% | not viable |
| 13D, well-known activists | 2.58x | 6.52% | 12.21% | 12.63% | not viable |
| "Strategic alternatives" | 2.83x | 10.14% | 13.32% | 13.11% | not viable |
Columns two and three appear to contradict each other. The lift goes up, the portfolio goes down, and in three of four arms the portfolio even lands below its own control group. The contradiction dissolves once you look at the order of events: all three signals are public filings. They are available to everyone the day they appear, and the price has digested them long before our portfolio buys at the next month-end. What gets bought is not the elevated probability - it is the elevated probability at the price of the elevated probability.
Then comes the less comfortable half. Companies an activist buys into, or that announce a sale process, are not a random slice of the market. They are disproportionately companies with a problem. If the deal fails to arrive - and within twelve months it fails to arrive in 91% of "strategic alternatives" cases and in 93% to 94% of 13D cases - the problem stays. That is exactly what the minus 1.83% median measures among the 13D names that were never acquired.
"I believe there is no other proposition in economics which has more solid empirical evidence supporting it than the Efficient Market Hypothesis."
Michael C. Jensen, "Some Anomalous Evidence Regarding Market Efficiency", Journal of Financial Economics, 1978.
Jensen wrote that line in a paper about anomalies - cases where the market appears not to be efficient at all. Part 3 supplies an example running the other way: an anomaly that genuinely exists (the lift is real and documented three times over) and stops existing the moment you try to trade it.
What this means for Parts 1 and 2
The Takeover Backtest Parts 1 and 2 failed on scarcity: at a base rate of 0.83%, even the theoretically strongest decile of the scoring model was left with nothing but noise. The obvious objection at the time was that the ground truth might simply have been too poor and the signal too quiet.
Part 3 removes both objections. The ground truth is now documented in regulatory filings and roughly five times larger, the base rate almost four times higher, and the signals are no longer quiet balance-sheet traits but loud public filings with demonstrable - in one case nearly triple - predictive power. The result is the same.
Takeover speculation is therefore refuted along both routes. The quiet route through company traits fails because it finds nothing. The loud route through public events fails because it arrives too late - whatever it finds, the market has already priced. That is not a disappointing outcome but a clean one: it says precisely where the boundary runs.
Limits of this analysis
- Panel coverage before roughly 2018 measures the source, not the market. Annual reports are missing for firms that vanished long ago; the share of takeovers that appear in the investment universe at all rises from 0% (2010-2012) to 79% (2025). Any yearly figure before 2018 is therefore of limited use - including for the stability condition of the decision rule.
- The benchmark index is a pure price index. The S&P 500 is only available without dividends. A portfolio that collects distributions holds a structural advantage of roughly two percentage points a year against that benchmark. The yardstick is handicapped in the portfolio's favour - and still no arm beats it.
- Year-by-year stability is not measurable for the two filing signals. A year only enters the stability test with at least 25 hits; for 13D activists and "strategic alternatives" not one year clears that bar. Their lift is documented over the full period, not per year.
- The coverage horizon ends in January 2025. A takeover only enters the dataset once completed, because it is discovered through the delisting. Positions ending after that cannot yet know a later-acquired stock as such - which pushes the measured share of acquired names down and therefore flatters the strategy rather than penalising it.
- Only 27% of first 13D filings can be mapped. Activists overwhelmingly target companies below the universe threshold of a $1 share price and $100 million market cap. This analysis makes no claim about activist campaigns in micro caps.
- Part of the documented takeovers rests on a single form type. 4,061 of the 5,599 takeovers carry a hard evidentiary form; for 1,538 (27.5%) the evidence rests on a merger prospectus (425) alone. Every core figure was therefore recomputed in a variant excluding those cases: for the two filing signals the lift actually rises there (13D from 1.46x to 1.65x, "strategic alternatives" from 2.83x to 3.37x), while for the industry wave it falls from 1.95x to 1.70x. The verdict is unchanged in every arm.
- Trading costs are conservative but incomplete. The base case uses 0.2% per leg with a 0.5% cross-check; bid-ask spread, market impact and taxes are not included. No result flips between the two cost levels.
For the back story, see the Takeover Backtest Parts 1 and 2 - how the cash-takeover pattern was counted, and why a twelve-trait scoring model failed against it. For warning signs ahead of a bankruptcy rather than a takeover, see the bankruptcy early-warning study. All further backtest studies are collected in the Studies section.
Figures as of 16 August 2026. Source: fundamental data & SEC filings (10-K/10-Q) plus the SEC form index and full-text search; last price month July 2026, announcement coverage horizon January 2025.
This article is a historical analysis of publicly available price, fundamental and regulatory data, and is not investment advice. It contains no buy or sell recommendation, no forecast, and no statement about any individual company listed today. The investor names mentioned serve solely to describe a comparison list fixed in advance. Past results - simulated or real - are not a reliable indicator of future returns. Anyone making investment decisions should assess their own situation and risks, and seek professional advice where in doubt.
Frequently Asked Questions
Part 3 tests whether three publicly visible events foreshadow a takeover: a fresh consolidation wave in the same industry, a first Schedule 13D filing by a large shareholder (an activist entry), and a board announcing a review of "strategic alternatives". Two things are measured separately - the takeover rate inside the window, and the return of a portfolio that buys on the signal.
Part 1 identified takeovers from the price series and therefore only ever found all-cash deals - 1,059 matches. Part 3 instead reads SEC filings and documents 5,599 takeovers across 4,202 firms, roughly five times as many. Of 37 known benchmark deals the new ground truth finds all 37; the price pattern found 12. The twelve-month base rate rises from 0.83% to 3.107%.
Measurably. The industry wave produces a 5.02% twelve-month takeover rate against 2.58% for matched comparison stocks (1.95x lift). A first Schedule 13D gives 5.65% against 3.86% (1.46x), and 6.67% against 2.59% (2.58x) when the filer is a well-known activist. The strongest is "strategic alternatives" at 9.14% against 3.23% (2.83x).
Because the higher probability is already in the price. Over twelve months and after costs, industry peers return 13.29% against 13.84% for the S&P 500 price index. Schedule 13D targets return 9.64% against a matched control group of 14.25%, and "strategic alternatives" names 10.14% against 13.32%. Buying after the event means paying the premium while carrying the discount when no deal arrives.
Only without a time window. Across the full observation period, 43.94% of companies announcing "strategic alternatives" are eventually acquired, which is close to the widely quoted 50%. Within twelve months of the announcement it is 15.48% of all matched filings and 9.14% inside the measured investment universe. For an investment decision, the window is what counts.
Four matter most. Panel coverage of takeovers rises sharply over time, so yearly figures before roughly 2018 measure the source rather than the market. The benchmark index is a price index without dividends, a structural handicap of about two percentage points a year - and it still is not beaten. Year-by-year stability cannot be measured for the two filing signals because no single year clears the 25-hit threshold. And only 27% of first 13D filings map into the universe: activists overwhelmingly target smaller companies.


