Momentum Backtest: The Typical Winner Returns 2.2% in Six Months, the Middle of the Field 4.3% to 4.6%
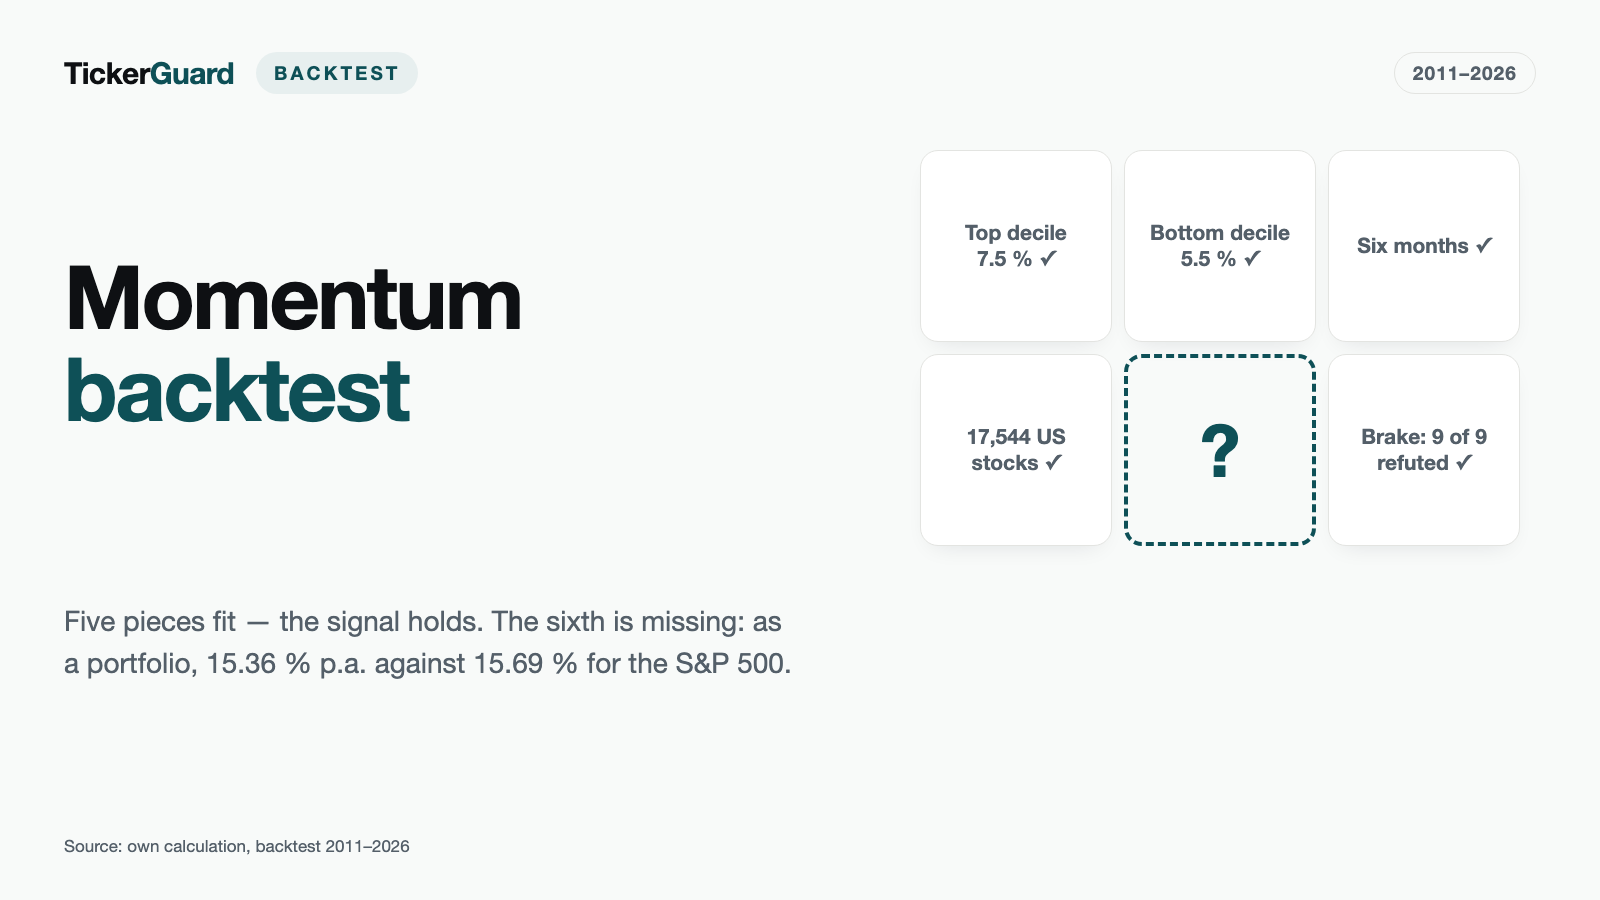
The best-known anomaly in market research is also one of the most misread: "buy winners, avoid losers" sounds like a simple rule, but what Jegadeesh and Titman actually measured in 1993 was more precise — a decile, not a single stock, and an average, not a promise for your next purchase. We reran the original recipe on a price database of 17,544 US stocks from 2011 through 2026, alongside a second, independently pre-registered in-house counter-thesis: that stocks which have already run up hard are better avoided. The result splits in two. Classic 12-1 momentum holds almost perfectly on average up to six months, yet the typical winner stock lags the middle of the field at every horizon, and the tradable overlapping portfolio narrowly misses the benchmark. The run-up brake, by contrast, fails cleanly — in all nine tested cells.
 Thomas Mücke
Founder & Publisher
Thomas Mücke
Founder & Publisher
The question: does the original recipe hold, and does caution pay?
In 1993, Narasimhan Jegadeesh and Sheridan Titman published one of the most cited findings in capital markets research: stocks that rose the most over recent months go on to beat the weakest on average, over holding periods of three to twelve months. We reran that question on a price database of 17,544 US stocks over April 2011 to July 2026 — between 3,221 and 4,075 of them were eligible at any given date. The calculation uses the now-standard 12-1 convention — "12-1" stands for the return over the trailing twelve months, with the most recent, twelfth month left out. That definition follows Carhart (1997) and the momentum factor of the Fama-French data library.
Alongside it sat a second, independently pre-registered question from our own newsroom: does it pay to avoid stocks that have already run up hard — by more than 10, 15 or 30 percent over three, six or twelve months? This "run-up brake" has no precedent in the original literature; it tests a plausible intuition, not an established factor.
The boundary of this backtest up front: price data starts in April 2010. The 2009 momentum crash — the best-known failure of this strategy, documented by Daniel and Moskowitz (2016) — sits before the data window and is not measured here, only cited. Anyone reading robustness across all market regimes into these numbers is overstating them.
The result in four numbers
Is it a good idea to buy stocks that have already run up hard — or to avoid them instead? We tested both against roughly 15 years of the US stock market (2011 to 2026): the classic momentum recipe and the counter-rule "run-up brake." Four numbers carry the result:
- 15.36% per year is what the classic momentum portfolio returned (the strongest stocks of the trailing twelve months, each held for six months), before costs.
- 15.69% is what the S&P 500 with dividends returned over exactly those same months — so the recipe trails it.
- 2.2% is what the typical stock in the top decile returned over six months — less than the typical stock in the whole market (3.7%). The good average lives on a handful of standout performers alone.
- 9.6% per year is what the best of the nine run-up-brake variants ("avoid stocks that already ran up hard") returned — the unfiltered market returned 10.1%. Avoidance cost return in all nine variants, without lowering risk.
In the tested window, a strong price run-up alone was neither a buy signal nor a warning sign — the index came out slightly ahead over the same months, at markedly lower volatility.
The classic: mean on top, median below
At each date, the eligible universe is split into ten equal-sized groups by 12-1 return. Such a group is called a decile — one-tenth of all stocks: decile 10 holds the ten percent with the strongest return, decile 1 the ten percent with the weakest. Shown is the cohort's return over the respective holding period — mean, median, and a mean trimmed by the most extreme 5% on each side.
| Decile | 1 month | 3 months | 6 months | 12 months |
|---|---|---|---|---|
| 1 (weak) | 0.6% | 2.0% | 5.5% | 15.5% |
| 5 (middle) | 0.9% | 2.8% | 5.9% | 12.3% |
| 6 (middle) | 1.0% | 3.0% | 6.0% | 12.1% |
| 10 (strong) | 1.4% | 4.0% | 7.5% | 14.9% |
| Universe | 0.9% | 2.9% | 6.0% | 12.9% |
| Benchmark (S&P 500 TR) | 1.2% | 3.6% | 7.3% | 15.2% |
| Decile | 1 month | 3 months | 6 months | 12 months |
|---|---|---|---|---|
| 1 (weak) | −0.6% | −1.0% | −0.9% | 1.8% |
| 5 (middle) | 0.7% | 2.1% | 4.3% | 8.9% |
| 6 (middle) | 0.8% | 2.2% | 4.6% | 9.0% |
| 10 (strong) | 0.3% | 0.9% | 2.2% | 4.1% |
| Universe | 0.5% | 1.7% | 3.7% | 7.8% |
Three observations belong together:
- On average, return rises with the decile — almost perfectly monotonic up to six months. Over six months the top decile returns 7.5% against 5.5% for the bottom. Over twelve months the picture reverses: the bottom decile leads at 15.5% against the top decile's 14.9%. De Bondt and Thaler (1985) describe this kind of long-run reversal over three to five years — here it is already visible on a one-year horizon.
- The typical winner stock is not a winner. The top decile's median return over six months is 2.2% — clearly below the medians of both middle-field deciles 5 and 6 (4.3% and 4.6%). Trim the most extreme 5% on each side and the top decile falls to 4.8%, behind those same two deciles (5.0% and 5.0%).
- The average edge comes from the right tail — a handful of very large winners, not the rule itself. Over twelve months the top decile beats the benchmark in only 41.9% of the 172 cohorts (72 of 172).
This is not a contradiction, it is the description of a skewed outcome: holding the full decile equal-weighted captures the mean. Picking individual stocks from it captures, with high probability, the median — which for the top decile sits below the middle of the field. Readers who want to see the current strongest names by relative strength can find them in our live RS Leader scanner; it reflects the momentum selection, but it does not replace the gap between average and typical outcome shown here.
"We find that the profitability of these strategies are not due to their systematic risk or to delayed stock price reactions to common factors. […] The evidence is, however, consistent with delayed price reactions to firm-specific information."
— Jegadeesh, N. / Titman, S.: "Returns to Buying Winners and Selling Losers", Journal of Finance 48(1), 1993, abstract p. 65 and p. 89
Three counter-tests
Without price and liquidity filters the gap between the edges widens rather than shrinks: over six months 8.6% for the top decile against 3.7% for the bottom. The top decile's median, however, drops to just 1.1%. The gain comes from stocks that, at that size, nobody could actually buy — an artefact of the calculation, not an achievable return.
Marking delisted stocks to zero instead of the last price flips the top decile's edge: over six months 2.7% against 3.0% for the bottom decile (universe 3.3%), over twelve months 7.0% against 8.7% (universe 7.2%). The truth sits between the generous assumption — last price, used everywhere else in this study — and this harsh one. The gap shows how much weight rests on a handful of delisting cases.
The one-month reversal — the classic short-term reversal hypothesis (Jegadeesh 1990) — is not tradable in this dataset: prior-month losers return a mean 0.7% the following month, prior-month winners 0.9%; the middle of the field sits above both (decile 6: 1.0%), and the best decile of this run is decile 3 (1.0%) — neither edge. A contrarian strategy would have no basis here.
The run-up brake: it costs both return and safety
The second, independently pre-registered thesis came from our own newsroom: avoiding stocks that have already run up hard should be calmer and better. Nine cells were tested — avoid stocks up more than 10, 15 or 30 percent over three, six or twelve months. Each cell shows the braked universe, the mirror arm (exactly the excluded stocks), and the full equal-weighted universe as the yardstick — all three on the full series of 183 months. There, the universe returns 10.1% p.a., at a Sharpe ratio of 0.61 (it weighs return against the risk taken to get it — the higher, the better) and a maximum drawdown of 32.1% (also called MaxDD: the deepest fall from a prior high to the low point that follows it).
| Cell | Excluded (mean per date) | braked p.a. | Sharpe | Drawdown | mirror arm p.a. | Sharpe | Drawdown |
|---|---|---|---|---|---|---|---|
| above 10% in 3 mo | 30.7% | 9.1% | 0.56 | 32.4% | 11.0% | 0.67 | 31.3% |
| above 10% in 6 mo | 39.6% | 7.9% | 0.49 | 33.2% | 13.2% | 0.80 | 31.5% |
| above 10% in 12 mo | 48.2% | 5.9% | 0.39 | 39.2% | 13.3% | 0.83 | 26.7% |
| above 15% in 3 mo | 21.9% | 9.3% | 0.57 | 32.5% | 11.5% | 0.68 | 29.7% |
| above 15% in 6 mo | 31.8% | 8.5% | 0.53 | 33.0% | 13.5% | 0.79 | 31.4% |
| above 15% in 12 mo | 42.3% | 6.7% | 0.43 | 37.5% | 13.6% | 0.84 | 27.6% |
| above 30% in 3 mo (best cell) | 8.6% | 9.6% | 0.59 | 32.2% | 12.8% | 0.66 | 33.3% |
| above 30% in 6 mo | 16.4% | 9.2% | 0.57 | 32.4% | 15.1% | 0.80 | 31.8% |
| above 30% in 12 mo | 27.5% | 8.2% | 0.51 | 34.1% | 14.4% | 0.82 | 28.1% |
The result is the same in all nine cells: the best braked cell still trails the full universe at 9.6% p.a. against 10.1%, the worst sits at 5.9%. Avoidance buys no safety — the braked series' Sharpe ratio sits below the universe's in every cell, and the maximum drawdown shrinks nowhere. The excluded stocks — the mirror arm, between a twelfth and just under half of the universe depending on the cell — outperform the braked remainder in every cell, on return and on risk-adjusted terms alike.
Layered as an extra filter on the already-strongest decile, the brake takes away more than it adds. The yardstick here is the monthly-rebuilt top decile over the same full series of 183 months: 15.0% p.a. at a Sharpe ratio of 0.73. (In the shorter portfolio window of the next chapter the very same series shows a higher figure — its five ramp-up months are missing there.) Across the six cells that stay populated over all 183 months, the filter trails the unfiltered top decile in five of them and leads in one — at "above 30% in 3 mo", by +0.11 percentage points, well within what nine trials produce by chance alone. The remaining three cells exclude nearly the whole decile — up to 99.3% of its positions on average across all dates — and then drop out of the series for months at a time rather than sitting in it at zero return; they are not comparable with the rest.
The literature explains why intuition fails here: short-term reversal operates over a week (Lehmann 1990) to a month (Jegadeesh 1990) — not even measurable on a monthly horizon in this dataset, as shown above — and long-run reversal (De Bondt/Thaler 1985) only kicks in over three years and beyond. On the three-to-twelve-month window the brake actually tests, continuation dominates instead.
The portfolio: six cohorts running at once
Up to this point, cohorts stood for groups of stocks measured over their own holding periods, spanning the calendar. A portfolio is different: at every month end, one-sixth of the capital moves into the fresh top decile, held for six months, so six cohorts always run side by side — Jegadeesh/Titman's overlapping construction, also called an overlapping portfolio. Only from that does a series of calendar months emerge, and with it Sharpe, maximum drawdown and trading costs.
| Series | p.a. before costs | after costs (0.1%) | after costs (0.25%) | Sharpe | Max drawdown |
|---|---|---|---|---|---|
| Top-decile portfolio (6 cohorts, overlapping) | 15.36% | 15.04% | 14.55% | 0.76 | 29.96% |
| Top decile, rebuilt monthly | 18.14% | 17.36% | 16.22% | 0.86 | 29.16% |
| Universe, equal-weighted | 12.45% | 12.40% | 12.32% | 0.73 | 32.10% |
| Benchmark (S&P 500 TR) | 15.69% | — | — | 1.11 | 23.87% |
The tradable overlapping portfolio trails the benchmark in the identical window — 15.36% against 15.69% p.a., 15.04% and 14.55% after costs. Across the index's full series (183 months rather than the portfolio's 178), it returns only 13.89% p.a.; the portfolio's five ramp-up months therefore decide which way the comparison tips. The monthly-rebuilt top decile clearly beats the index instead (18.14% before costs, 17.36% after small costs) — the signal holds, but the cost-efficient overlapping construction gives back a good part of it. On a risk-adjusted basis the index leads in every case: Sharpe 1.11 against 0.86 and 0.76, at a volatility of 14.1% against 22.3% and 22.0% — in the same order. The equal-weighted universe returns 12.45% p.a. over the same window, October 2011 to July 2026.
Regime: bear and bull, Covid and the rate turn
The dividing line was set before the first number: bear means the benchmark's month-end level sits more than 20% below its prior high, measured at the end of the previous month. Across the whole backtest this rule delivers just two bear months (October 2011, October 2022) — too few for a robust claim, and the reason belongs with the number: on month-end prices, the March 2020 crash narrowly missed the 20% mark.
The two full market episodes in the window are more informative:
- 2020, Covid crash and fast recovery (February 2020 to August 2020, chained): the overlapping portfolio returned a cumulative +17.9%, the monthly top decile +22.1%, the benchmark +9.8% — momentum led clearly, while the equal-weighted universe stood at −0.2%.
- 2022, the rate turn without a crash day (January 2022 to December 2022, chained): the overlapping portfolio came in at −7.4%, the monthly top decile at −3.1%, the benchmark at −18.1% — here momentum led defensively, while the unfiltered universe (−18.6%) tracked the index down.
The 2009 momentum crash sits before the data start (April 2010) and is therefore not a measurement of this backtest, only a literature finding. Daniel and Moskowitz (2016) show that momentum crashes hit the short leg above all — in March to May 2009 the loser decile rose 163 percent, the winner decile only 8 percent. Our backtest trades only the buy side and would, by construction, not have been directly exposed to that specific mechanism; the window here is nonetheless too short to claim that rather than merely suspect it.
What trading costs
Turnover is measured, not estimated: the share of the portfolio that must be rebought each month, deducted on both sides at 0.1% (sensitivity check at 0.25%) before chaining. Rebuying the top decile every single month means a median turnover of 27.4% — the overlapping portfolio, which refreshes only one-sixth each month, gets by on 11.9%. The gentler construction is therefore not only the cleaner measurement but also the cheaper one to run, even though it returns less before costs. That trade-off is the subject of Korajczyk and Sadka (2004), who show that momentum profits shrink with the capital deployed once market impact is priced in — our fixed per-side rate is the friendlier assumption.
How we calculated it
- Universe and period. The broad US market including NASDAQ, a price database of 17,544 stocks, 11,144 of them since delisted; 183 dates from April 2011 through June 2026, giving 183 measured return months from May 2011 through July 2026; equal-weighted deciles by 12-1 return. Between 3,221 and 4,075 stocks were eligible at each date, a median of 3,663.
- Filters. Raw price at least $1, median dollar volume over the trailing 63 trading days at least $500K, a trading day only counts with at least 500 stocks; sensitivity run without these filters, see the counter-tests.
- Buy side only. Unlike the Jegadeesh/Titman original (zero-cost, winners minus losers), the main run trades only the buy side; the loser decile is reported for documentation only.
- Costs. 0.1% per trading side on the measured turnover, 0.25% as a sensitivity check; the Jegadeesh/Titman original is computed before costs.
- Trimmed mean. For the third column of the decile calculation, the most extreme 5% on each side are dropped.
- Limits. The window starts after the 2009 momentum crash, has only two bear months under the pre-registered rule, ignores taxes, assumes a zero risk-free rate, and measures maximum drawdown on monthly data — a daily measure would run deeper. Every one of these simplifications makes the result more favourable, not stricter.
Sources. Our own price database of 17,544 US stocks including delisted names; the benchmark is the S&P 500 Total Return. Literature: Jegadeesh/Titman 1993, Carhart 1997, Jegadeesh 1990, Lehmann 1990, De Bondt/Thaler 1985, Daniel/Moskowitz 2016, Korajczyk/Sadka 2004.
What survives
Thesis 1 (momentum) — only partly confirmed. The top decile beats the bottom on average, and rebuilt monthly it beats the benchmark in the same window. Four qualifications belong right next to that: the tradable overlapping portfolio trails the index; on a risk-adjusted basis the index leads both variants; breadth is missing — the top decile beats the index in only 41.9% of its 172 twelve-month cohorts, and its median sits below the middle of the field; and the edge disappears under the harsh mark-to-zero assumption for delistings. The signal holds — equal-weighted, fully held, and expensive to capture. As a stock-picking tool it does not.
Thesis 2 (run-up brake) — refuted. In all nine cells, avoiding the strong risers costs return without saving on risk. The thesis failed on its own numbers — a plausible intuition the measurement did not confirm.
No live scanner comes out of this backtest, deliberately: a recipe whose tradable version loses 15.36% against 15.69% p.a. over the tested window is not something we ship as a product. More backtest studies in this series live together under Studies.
Figures as of August 9, 2026.
This article is a historical analysis of publicly available price data and not investment advice. It contains no buy or sell recommendation and no forecast; individual companies named in it serve solely to illustrate historical price patterns. Past results — whether simulated or real — are not a reliable indicator of future returns. Anyone making investment decisions should assess their own situation and risks, if in doubt with professional advice.
Frequently Asked Questions
Stocks are ranked by their return over the trailing twelve months, skipping the most recent month — hence "12-1". The top ten percent by formation return make up the top decile, which is then held for a fixed period. The most recent month is dropped because monthly returns tend to reverse rather than continue (short-term reversal), which would otherwise contaminate the signal. The convention goes back to Jegadeesh/Titman (1993) and has been computed this way since Carhart (1997).
On average, and up to a six-month hold: clearly yes. As a tradable portfolio with an overlapping construction: narrowly no — 15.36% against 15.69% p.a. in the identical window of 178 months, and on a risk-adjusted basis the index leads clearly (Sharpe 1.11 against 0.76). Only the more expensively traded, fully monthly-rebuilt variant beats the index before costs (18.14%) and after small costs (17.36%).
Because the top decile's mean is carried by a handful of very large outliers, while the median — the typical stock — sits below the middle-field deciles at every measured horizon: over six months 2.2% against 4.3% in the fifth and 4.6% in the sixth decile. Holding the full decile equal-weighted captures the outliers; picking individual stocks more often lands on the below-average median.
Not according to this measurement. Across all nine tested combinations of run-up threshold (10, 15, 30 percent) and lookback window (3, 6, 12 months), the braked universe lost return without any improvement in Sharpe or maximum drawdown. The excluded stocks themselves — the mirror arm — outperformed the braked remainder in every single cell.
Because two monthly windows sit side by side — and that affects not just the universe but every series, the top decile included. The full series covers 183 return months from May 2011 — the first ranking date sits one month earlier. The portfolio window starts five months later (October 2011) and covers 178 months, because the overlapping portfolio is only fully invested from then on. The equal-weighted universe therefore returns 10.07% p.a. in the full series and 12.45% in the portfolio window; the monthly-rebuilt top decile returns 14.97% and 18.14% respectively. All four figures are correct; every table and every sentence names its window.
It sits outside this study's data window — price data starts in April 2010 — and is cited only as a literature finding, not measured. Daniel and Moskowitz (2016) show that such crashes hit the short leg of zero-cost strategies above all; our backtest trades only the buy side and is, by construction, less exposed to that mechanism — but that cannot be settled conclusively within this window.
No. This is market research on two pre-registered theses, not a product promise. It describes the conditions under which the rules held in hindsight — not that they will do so again. Readers who want to see the current strongest names by relative strength can find them in our live RS Leader scanner.


